|
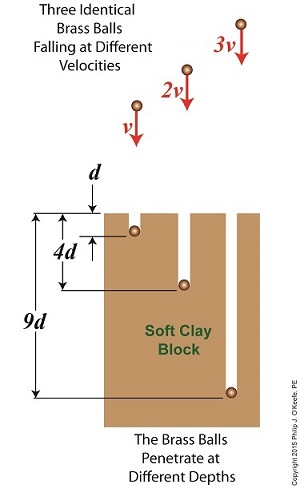
Last time we introduced The Law of Conservation of Energy, which holds that energy can neither be created nor destroyed. We then applied the concept to a mug resting on a shelf, brimming with latent gravitational potential energy. Today we’ll continue our discussion with a focus on kinetic energy and how Willem Gravesande’s experimentation contributed to our understanding of the subject. The concept of kinetic energy was first posited by mathematicians Gottfried Leibniz and Johann Bernoulli in the early 18th Century when they theorized that the energy of a moving object is a factor of its mass and speed. Their theory was later proven by Willem Gravesande, a Dutch lawyer, philosopher, and scientist. Gravesande conducted experiments in which he dropped identical brass balls into a soft clay block. See Figure 1. Figure 1 Figure 1 shows the results obtained when balls of the same mass m are dropped from various heights, resulting in different velocities as they fall and different clay penetrations. The ball on the left falls at velocity v and penetrates to a depth d. The center ball falls at twice the left ball’s velocity, or 2v, and penetrates four times as deep, or 4d. The right ball falls at three times the left ball’s velocity, 3v, and it penetrates nine times deeper, 9d. The results indicate an exponential increase in clay penetration, dependent on the balls’ speed of travel. In fact, all the kinetic energy that the balls exhibited during freefall was converted into mechanical energy from the instant they impacted the clay until their movement within it stopped. This change in forms of energy from kinetic to mechanical demonstrates what Julius Robert von Mayer had in mind when he derived his Law of Conservation of Energy. For a refresher on the subject, see last week’s blog, The Law of Conservation of Energy. As a result of his experimentation, Gravesande was able to conclude that the kinetic energy of all falling objects is a factor of their mass multiplied by their velocity squared, or m × v2. We’ll see next time how Gravesande’s work paved the way for later scientists to devise the actual formula used to calculate kinetic energy and then we’ll apply it all to our coffee mug falling from the shelf. Copyright 2015 – Philip J. O’Keefe, PE Engineering Expert Witness Blog ____________________________________
|
Archive for the ‘Professional Malpractice’ Category
Willem Gravesande’s Experimentation on Kinetic Energy
Friday, September 11th, 2015Gravity and the Mass of the Sun
Friday, December 12th, 2014|
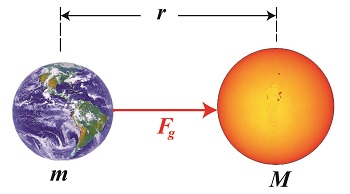
As a young school boy I found it hard to believe that scientists were able to compute the mass of our sun. After all, a galactic-sized measuring device does not exist. But where there’s a will, there’s a way, and by the 18th Century scientists had it all figured out, thanks to the work of others before them. Newton’s two formulas concerning gravity were key to later scientific discoveries, and we’ll be working with them again today to derive a third formula, bringing us a step closer to determining our sun’s mass. Newton’s Second Law of Motion allows us to compute the force of gravity, Fg, acting upon the Earth, which has a mass of m. It is, Fg = m × g (1) Newton’s Universal Law of Gravitation allows us to solve for g, the sun’s acceleration of gravity value, g = (G × M) ÷ r2 (2) where, M is the mass of the sun, r is the distance between the sun and Earth, and G is the universal gravitational constant. You will note that g is a common factor between the two equations, and we’ll use that fact to combine them. We’ll do so by substituting the right side of equation (2) for the g in equation (1) to get, Fg = m × [(G × M) ÷ r2] then, using algebra to rearrange terms, we’ll set up the combined equation to solve for M, the sun’s mass: M = (Fg × r2) ÷ (m × G) (3) At this point in the process we know some values for factors in equation (3), but not others. Thanks to Henry Cavendish’s work we know the value of m, the Earth’s mass, and G, the universal gravitational constant. What we don’t yet know is Earth’s distance to the sun, r, and the gravitational attractive force, Fg, that exists between them. Next time we’ll introduce some key scientists whose work contributed to a method for computing the distance of our planet Earth to its sun. _______________________________________
|
The Relationship Between Torque and Horsepower
Tuesday, July 15th, 2014| We’ve been discussing gear trains for some time now, and last time we posed the question: Why even bother using a gear train and performing complex computations to arrive at a desired torque for an application? Why not just use a bigger motor to start with? Today we’ll see why.
First, we must acknowledge that sometimes higher torque is achieved by simply using a more powerful motor. But sometimes this isn’t possible or practical. To begin our discussion, we must first understand how torque is related to motor power, the amount of mechanical work a motor can perform. Torque is in fact a function of how much mechanical power a motor produces. In the United States motor power is typically measured in units of horsepower. The following equation illustrates the relationship between torque, horsepower, and motor speed: T = [HP ÷ n] × 63,025 where T is the motor shaft’s torque in units of inch-pounds, HP is the motor’s horsepower, and n is the speed of the motor shaft in revolutions per minute (RPM). The number 63,025 in the equation is a constant used to convert the units of horsepower and RPM into units of torque (inch pounds). This equation applies to all sources of mechanical power. Its versatility enables design engineers to easily determine if a mechanical power source can deliver the torque required to drive a particular piece of machinery. The torque equation above tells us that in order to get a higher torque T for a given speed n, you’ll have to get a motor with a higher HP. Put another way, if your speed remains constant and you use a motor with higher horsepower, you’ll get more torque for your application simply by increasing the horsepower. Next time we’ll plug numbers into our equation and see how it all works. _______________________________________
|
The Mathematical Link Between Gears in a Gear Train
Wednesday, May 14th, 2014|
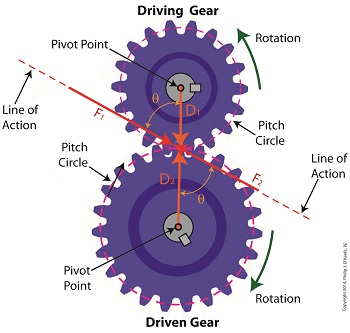
Last time we analyzed the angular relationship between the Force and Distance vectors in this simple gear train. Today we’ll discover a commonality between the two gears in this train which will later enable us to develop individual torque calculations for them. From the illustration it’s clear that the driving gear is mechanically linked to the driven gear by their teeth. Because they’re linked, force, and hence torque, is transmitted by way of the driving gear to the driven gear. Knowing this we can develop a mathematical equation to link the driving gear Force vector F1 to the driven gear Force vector F2, then use that linking equation to develop a separate torque formula for each of the gears in the train. We learned in the previous blog in this series that F1 and F2 travel in opposite directions to each other along the same line of action. As such, both of these Force vectors are situated in the same way so that they are each at an angle value ϴ with respect to their Distance vectors D1 and D2. This fact allows us to build an equation with like terms, and that in turn allows us to use trigonometry to link the two force vectors into a single equation: F = [F1 × sin(ϴ)] – [F2 × sin(ϴ)] where F is called a resultant Force vector, so named because it represents the force that results when the dead, or inert, weight that’s present in the resisting force F2 cancels out some of the positive force of F1. Next week we’ll simplify our gear train illustration and delve into more math in order to develop separate torque computations for each gear in the train. _______________________________________ |
Gear Terminology
Sunday, January 5th, 2014|
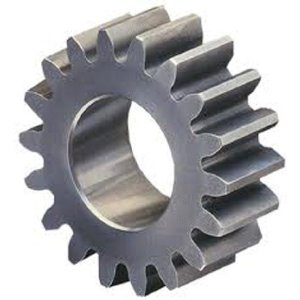
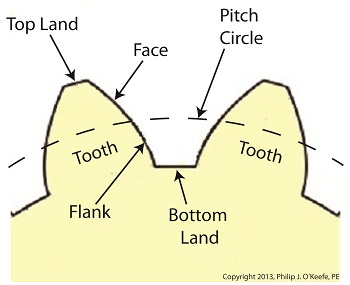
Last time we reviewed the ancient origins of gears and saw how they’ve been around a lot longer than most people realize. Now let’s familiarize ourselves with the terminology of modern gears by taking a look at the most basic and commonly used gear construction, the spur gear. A spur gear is shown below, so named due to its resemblance to spurs commonly found attached to horse riding boots. At their most basic gears are wheels containing many projections which resemble teeth. These teeth are equally spaced around the wheel’s circumference and are designed to mesh, or fit together, with the teeth of other like gears. Looking more closely at the teeth of a modern spur gear, we see they have a rather complex and peculiar curved shape, along with their own terminology. There’s a pitch circle that intersects each gear tooth between the root of the tooth, or bottom land, and the tip of the tooth, or top land. Above the pitch circle each tooth side bears a face. Below the pitch circle and under each face is a flank. Spur gear teeth don’t necessarily have to have this shape. All that’s required is that the teeth fit together in such a way so as to permit fluid interaction between them as they rotate. As a matter of fact, some primitive gears consisted of wooden wheels with teeth made of wooden pegs. These pegs were inserted into evenly spaced holes which were drilled around the circumference of the wheel. The wooden pegs of each wheel would mesh with one another, and when one gear wheel was caused to rotate, its pegs would press against the pegs of the other gear, making it rotate along with it. So if simple pegs worked well enough, then why are modern gear teeth so specifically shaped? We’ll see why next time when we join gears together to form a gear train. ________________________________________ |
How Condensers Increase Efficiency Inside Power Plants
Wednesday, December 4th, 2013|
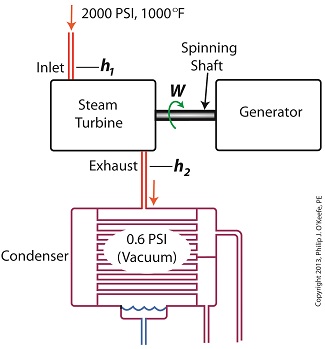
Last time we ran our basic power plant steam turbine without a condenser. In that configuration the steam from the turbine exhaust was simply discharged to the surrounding atmosphere. Today we’ll connect it to a condenser to see how it improves the turbine’s efficiency. As discussed in a previous blog, enthalpy h1 is solely dependent on the pressure and temperature at the turbine inlet. For purposes of today’s discussion, turbine inlet steam pressure and temperature will remain as last time, with values of 2,000 lbs PSI and 1000°F respectively, and calculations today will be based upon those values. So to review, the inlet enthalpy h1 is, h1 = 1474 BTU/lb If the condenser vacuum exists at a pressure of 0.6 PSI, a realistic value for a power plant condenser, then referring to the steam tables in the Van Wylen and Sonntag thermodynamics book, we find that the enthalpy h2 will be, h2 = 847 BTU/lb and the amount of useful work that the turbine can perform with the condenser in place would therefore be, W = h1 – h2 = 1474 BTU/lb – 847 BTU/lb = 627 BTU/lb So essentially with the condenser present, the work of the turbine is increased by 168 BTU/lb (627 BTU/lb – 459 BTU/lb). To put this increase into terms we can relate to, consider this. Suppose there’s one million pounds of steam flowing through the turbine each hour. Knowing this, the turbine power increase, P, is calculated to be, P = (168 BTU/lb) ´ (1,000,000 lb/hr) = 168,000,000 BTU/hr Now according to Marks’ Standard Handbook for Mechanical Engineers, a popular general reference book in mechanical engineering circles, one BTU per hour is equivalent to 0.000393 horsepower, or HP. So converting turbine power, P, to horsepower, HP, we get, P = (168,000,000 BTU/hr) ´ (0.000393 HP/BTU/hr) = 66,025 HP A typical automobile has a 120 HP engine, so this equation tells us that the turbine horsepower output was increased a great deal simply by adding a condenser to the turbine exhaust. In fact, it was increased to the tune of the power behind approximately 550 cars! What all this means is that the stronger the vacuum within the condenser, the greater the difference between h1 and h2 will be. This results in increased turbine efficiency and work output, as evidenced by the greater numeric value for W. Put another way, the turbine’s increased efficiency is a direct result of the condenser’s vacuum forming action and its recapturing of the steam that would otherwise escape from the turbine’s exhaust into the atmosphere. This wraps up our series on the power plant water-to-steam cycle. Next time we’ll use the power of 3D animation to turn a static 2D image of a centrifugal clutch into a moving portrayal to see how it works. ________________________________________ |
Forms of Heat Energy – Boiling Water and Atmospheric Pressure
Sunday, July 21st, 2013|
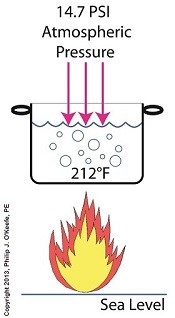
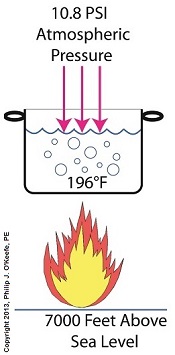
If you’ve ever baked from a pre-packaged cake or cookie mix, you’ve probably noticed the warning that baking times will vary. That’s because the elevation of the area in which you’re doing the baking makes a difference in the baking time required. Living in New Orleans? Then you’re at or below sea level. In Colorado? Then you’re above sea level. Your cake will be in the oven more or less time at the prescribed temp, depending on your location. Last time we learned how the heat energy absorbed by water determines whether it exists in one of the three states of matter, gas, liquid, or solid. We also learned that at the atmospheric pressure present at sea level, which is about 14.7 pounds per square inch (PSI), the boiling point of water is 212°F. At sea level there are 14.7 pounds of air pressure bearing down on every square inch of water surface. Again, I said sea level for a reason. The boiling point of water, just like cake batter baking times, is dependent upon the amount of pressure that’s being exerted on its surface from the surrounding atmosphere. When heat energy is absorbed, it causes the water or cake batter molecules to move around. In fact, the temperature measured is a reflection of this molecular movement. As more heat energy is absorbed, the molecules move more and more rapidly, causing temperature to increase. When the water temperature in our tea kettle reaches its boiling point of 212°F at sea level, the steam molecules in the bubbles that form have enough energy to overcome the atmospheric pressure on the surface of the water. They become airborne and escape in the form of steam. If we’re up in the Rockies at say an altitude of 7000 feet above sea level, the atmospheric pressure is only about 10.8 PSI. There’s just less air up there. That means there’s less air pressure resting upon the surface of the water, so it’s far easier for steam molecules to form into bubbles and leave the surface. As a result the boiling point is much lower in the Rockies than it is at sea level, 196°F versus 212°F. So what if the water was boiling in an environment that had even higher pressures exerted upon it than just atmospheric? We’ll see how to put this pent-up energy to good use next week, when we begin our discussion on how steam is used within electric utility power plants.
___________________________________________
|
Courtroom Animations – Influencing Jury Perception
Monday, July 1st, 2013| Last week we began our discussion on perception and how without visual cues individuals exposed to the same verbal information will oftentimes arrive at different conclusions as to what they just heard. We also touched on the fact that peoples’ attention spans are extremely limited, so much so that experts studying human behavior conclude that even when the subject matter is extremely interesting to the listener, their ability to absorb information is limited to mere minutes.
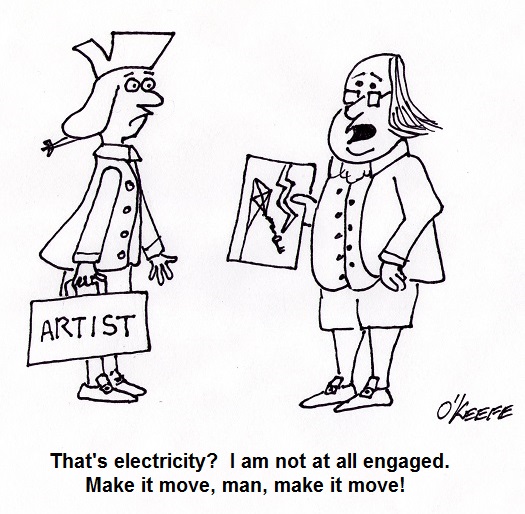
No one would argue the fact that we live in the Visual Age. Most images are flashed at us for only a few seconds. Our appetites for visual arousal seem never to be satiated, and venues that lack a visual component are suffering shrinking audiences. Orchestras come to mind. Even pop stars and professional sporting events today employ huge screens to “up” their visual content in the hopes of keeping their audiences engaged. This phenomenon was addressed way back in 1982, when the internet and its cornucopia of images was just a baby. Dr. Donald E. Vinson, a leader in courtroom behavior and trial strategy, wrote in the March, 1982 edition of Trial Magazine, “Attention span and the arousal of attention are fundamental to all perception,” a sentiment which Benjamin Franklin echoed in his statement, “If you would persuade, you must appeal to interest rather than intellect.” Dr. Vinson also states that, “Perceptions are constantly subject to emotional reinforcement, and those which are positively reinforced will tend to be better remembered.” And what’s supplying these necessary emotional reinforcements? Stimulation to the senses. And what type of stimulation is most effective? In Dr. Vinson’s opinion, “A moving stimulus is also more effective than a static one.” So will shortened modern-day attention spans result in speed trials that are equivalent to short movies? Anything is possible, but our legal system as it stands today isn’t able to produce this just yet. So how is an attorney trying to impress their message upon jurors from diverse backgrounds and life experience going to succeed in getting their message across? And what if that message is complicated and requires certain technical aptitudes? Will verbal descriptions be enough? Considering the fact that the average adult American reads at or below the 5th grade reading level, it is unlikely. Research findings discovered more than 30 years ago still hold true today. Messages are most effectively received when employing visual cues, and the most effective visual cue is one that moves. There’s a good reason why my blogs seldom lack a visual component… ___________________________________________ |
Patent Drawings – “Ordinary Skill in the Art”
Sunday, June 9th, 2013|
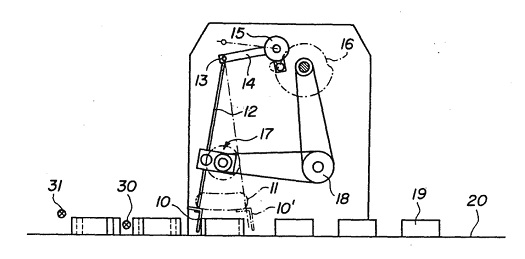
Last week I introduced this illustration as a typical patent drawing and asked if you could decipher the riddle of its functionality.
Patent drawings are static, two dimensional (2D) representations of proposed inventions which are meant to be manufactured in three dimensions (3D). As such they present a lot of complex information on a flat page. If you don’t have a clue as to what this machine is, I guarantee you’re not alone. The average person wouldn’t. There’s a bunch of lines, shapes and numbers, but what do they signify? How are they meant to all come together and operate? As a matter of fact, the average person isn’t meant to understand patent drawings. That’s because they’re not what patent courts have defined as a person of ordinary skill in the art, a peculiar term which basically means that the Average Joe or Josephine isn’t meant to be able to interpret them. Rather, the interpretation of patent drawings is left to individuals with specialized skills and training, a particular educational background and/or work experience. These individuals are typically able to view a static 2D image and visualize how the illustrated device moves, how it operates. Those said to fall within the court’s definition as having ordinary skill in the art are in fact often engineers and scientists. Since the average person does not have a background in engineering and science, it can be challenging for patent attorneys to present their cases in the courtroom, particularly when relying on 2D representations alone. That’s where animations come in. Next time we’ll use the magic of animation to transform our cryptic 2D patent illustration into a functional 3D animation of a machine whose operation is easily understood by the average person. ___________________________________________ |
