| My daughter will be studying for her driver’s license exam soon, and I can already hear the questions starting. “What does that sign mean? Why does this sign mean construction is ahead?” Symbols are an important part of our everyday lives, and in order to pass her test she’s going to become familiar with dozens of them that line our highways.
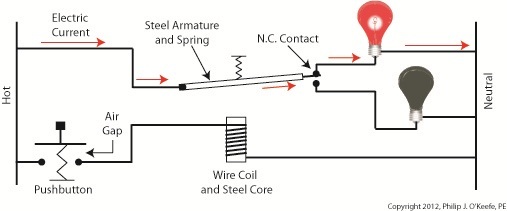
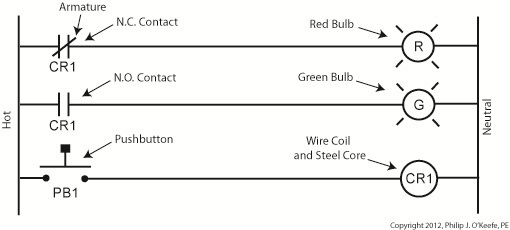
Just as a triangle on the highway is a symbol for “caution,” industrial control systems employ a variety of symbols in their diagrams. The pictures are shorthand for words. They simplify the message, just as hieroglyphics did for our early ancestors who had not yet mastered the ability to write. Ladder diagrams and the abstract symbols used in them are unique to industrial control systems, and they result in faster, clearer interpretations of how the system operates. Last week we analyzed an electric circuit to see what happens when we put a relay to use within a basic industrial control system, as found in Figure 1. Figure 1Now let’s see how it looks in an even simpler form, the three-rung ladder diagram shown in Figure 2. Figure 2In industrial control terminology the electric relays shown in ladder diagrams are often called “control relays,” denoted as CR. Since a ladder diagram can typically include many different control relays, they are numbered to avoid confusion. The relay shown in Figure 2 has been named “CR1.” Our ladder diagram contains a number of symbols. The symbol on the top rung which looks like two parallel vertical lines with a diagonal line bridging the gap between them represents the N.C. contact. This symbol’s vertical lines represent an air gap in the N.C. contact, the diagonal line is the relay armature which performs the function of bridging/closing the air gap. This rung of the ladder diagram represents the contact when the relay is in its normal state. In the middle ladder rung the N.O. contact symbol looks like two parallel vertical lines separated by a gap. There is no diagonal line running through it since the relay armature doesn’t touch the N.O. contact when this particular relay is in its normal state. The wire coil and steel core of this relay are represented by a circle on the bottom ladder rung. The contact and coil symbols on all three rungs are labeled “CR1” to make it clear that they are part of the same control relay. Other symbols within Figure 2 represent the red and green bulbs we have become familiar with from our initial illustration. They are depicted as circles, R for red and G for green, with symbolic light rays around them. The pushbutton, PB1, is represented as we have discussed in previous articles on ladder diagrams. Just as road sign symbols are faster than sentences for drivers speeding down a highway to interpret, ladder diagrams are faster than customary illustrations for busy workers to interpret. Next time we’ll expand on our electric relay by introducing latching components into the control system that will allow for a greater degree of automation. ____________________________________________ |
Posts Tagged ‘ladder logic’
Industrial Control Basics – Electric Relay Ladder Diagram
Sunday, January 22nd, 2012Tags: armature, automation engineer, bulb, contact, control relay, controls engineer, CR, electric relay, electrical contact, engineering expert witness, forensic engineer, hot, industrial automation, industrial control, ladder diagram, ladder diagram symbol, ladder logic, N.C. contact, N.O. contact, NC contact, neutral, NO contact, normal state, normally closed, normally open, pushbutton, relay, rung, steel core, wire coil
Posted in Engineering and Science, Expert Witness, Forensic Engineering, Innovation and Intellectual Property, Personal Injury, Product Liability, Professional Malpractice | 2 Comments »
Industrial Control Basics – Ladder Diagrams
Sunday, December 18th, 2011| The other day I pressed the button to activate my electric garage door opener and nothing happened. I pushed again and again, still nothing. Finally, I convinced myself to get out of the car and take a closer look. A wooden board I had propped up against the side of the garage wall had come loose, wedging itself in front of the electric eye, you know, the one that acts as a safety. The board was an obstruction to the clear vision of the eye. It couldn’t see the light emitter on the other side of the door opening and wouldn’t permit the door opener to function.
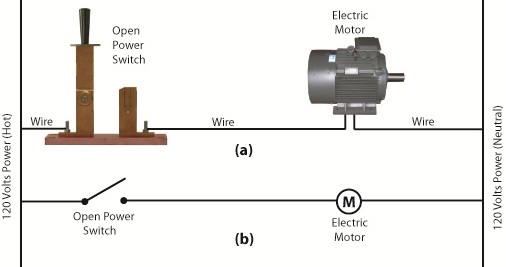
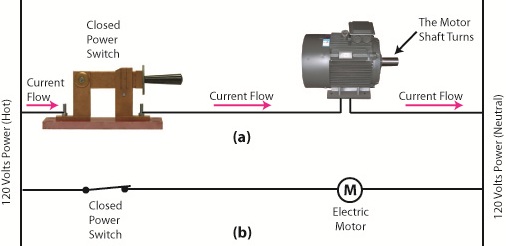
The basic manual control system we looked at last week operates similarly to the eye on a garage door opener. If you can’t “close the loop,” you won’t get the power. Last week’s example was as basic as things get. Now let’s look at something a bit more complex. Words aren’t always the best vehicle to facilitate understanding, which is why I often use visual aids in my work. In the field of industrial control systems diagrams are often used to illustrate things. Whether it’s by putting pencil to paper or the flow diagram of software logic, illustrations make things easier to interpret. Diagrams such as the one in Figure l are often referred to as “ladder diagrams,” and in a minute we’ll see why. Figure 1 Figure 1(a) shows a basic manual control system. It consists of wires that connect a power switch and electric motor to a 120 volt alternating current power source. One wire is “hot,” the other “neutral.” The hot side is ungrounded, meaning that it isn’t electrically connected to the Earth. The neutral side is grounded, that’s right, it’s driven into the ground and its energy is dissipated right into the earth, then returned back to the power grid. In Figure 1(a) we see that the power switch is open and an air gap exists. When gaps exist, we don’t have a closed electrical loop, and electricity will not flow. Figure 1(b), our ladder diagram, aka line diagram, shows an easier, more simplified representation of the manual control shown in Figure 1(a). It’s easier to decipher because there’s less going on visually for the brain to interpret. Everything has been reduced to simple lines and symbols. For example, the electric motor is represented by a symbol consisting of a circle with an “M” in it. Now, let’s turn our attention to Figure 2 below to see what happens when the power switch is closed. Figure 2 The power switch in Figure 2(a) is closed, allowing electric current to flow between hot and neutral wires, then power switch, and finally to the motor. The current flow makes the motor come to life and the motor shaft begins to turn. The line diagram for this circuit is shown in Figure 2(b). You might have noticed that the line diagrams show in Figures 1(b) and 2(b) have a rather peculiar shape. The vertically running lines at either side depict the hot and neutral legs of the system. If you stretch your imagination a bit, they look like the legs of a ladder. Between them run the wires, power switch, and motor, and this horizontal running line represents the rung of the ladder. More complicated line diagrams can have hundreds, or even thousands of rungs, making up one humongous ladder, hence they are commonly referred to as ladder diagrams. Next week we’ll take a look at two key elements in automatic control systems, the push button and electric relay, elements which allow us to do away with the need for human intervention. ____________________________________________ |
Tags: automatic control, electric circuit, electric current, electric motor, electric relay, electric utility, engineering expert witenss, forensic engineer, ground, hot, industrial control, ladder diagram, ladder logic, line diagram, manual control, motor control, neutral, power flow, power grid, power switch, push button, visual aid, wires
Posted in Courtroom Visual Aids, Engineering and Science, Expert Witness, Forensic Engineering, Innovation and Intellectual Property, Personal Injury, Product Liability, Professional Malpractice | Comments Off on Industrial Control Basics – Ladder Diagrams


