|
In this blog series we’ve been examining gear train usefulness, specifically in terms of increasing torque. Equations presented last week began us on the final leg of our journey, and we’ve arrived at the point where the closing combination of equations will demonstrate the loss of speed that takes place when torque is increased within a gear train. To that end, the two main equations under consideration as presented last week, are:
where R is the gear ratio of the gear train, N is the number of gear teeth, n is the gear rotational speed in revolutions per minute (RPM), T is the torque, and D is the gear pitch radius. We were able to link these two equations by working through five key design equations applicable to simplified gear trains. For the full step-by-step progression see last week’s blog. After working through the equations presented last time we were able to arrive at an equation which links equations (1) and (2). Here it is:
If you follow the color coding, you’ll see the elements of equations (1) and (2) which come together in equation (7). Because equation (7) links the gear speed ratios (red) with the gear pitch radii ratios (green), we can set the ratios in equation (1) equal to those in equation (2). Doing so, we get: R = NDriven ÷ NDriving = nDriving ÷ nDriven = DDriven ÷ DDrivng = TDriven ÷ TDriving
In order to see the tradeoff between speed and torque, we need only consider the parts of the equation which concern themselves with factors relating to speed and torque. Removing the other unnecessary factors, we arrive at:
Next week we’ll plug numbers into equation (8) and disclose the tradeoff of speed for torque.
_______________________________________
|
Posts Tagged ‘licensed professional engineer’
Determining the Gear Train Tradeoff of Torque vs. Speed, Part Two
Wednesday, August 20th, 2014The Gear Train Tradeoff
Tuesday, August 5th, 2014|
We’ve learned several methods to increase the torque of an electric motor through our series of articles on gear trains. One way is to attach a gear train to the motor’s shaft, a relatively simple thing to do. Today we’ll begin our exploration into how this method involves a tradeoff. It comes at the cost of speed. We’ll begin our examination of the tradeoff at play by linking together key elements learned through past blogs on the subject of gear trains. We’ll revisit those lessons through flashbacks. The first flashback we’ll make is to a blog entitled, Gear Ratio Formulas. There we learned that within a simple gear train consisting of two gears, the type most commonly employed to manipulate a motor’s torque, the ratio between the two gears, R, is relative to the ratio of their gear teeth, N. N is determined by the number of teeth each gear has in combination with the speeds, n, that each gear is going: R = NDriven ÷ NDriving = nDriving ÷ nDriven (1) The second flashback we’ll make is to a blog entitled, The Methodology Behind Gear Train Torque Conversions, in which we learned that the ratio of the torque, T, that exists between the gears is relative to the ratio of their respective pitch diameters, D: TDriving ÷ TDriven = DDriving ÷ DDriven (2) The tradeoff we’ve been alluding to comes in when gear speed, nDriven, represented in equation (1), is decreased, which results in an increase to TDriven in equation (2). But in order to see this we’ve got to somehow link the two equations together. In their present form there’s no common link between them. Or is there? There actually is an indirect link between the two equations, which comes by way of the torque equation presented in another past blog. The third flashback we’ll make is to the blog discussing that subject, which is entitled, The Relationship Between Torque and Horsepower. Using facts presented in that blog, the torque equations for our two gears become: TDriving = [HPDriving ÷ nDriving] × 63,025 (3) TDriven = [HPDriven ÷ nDriven] × 63,025 (4) Where’s the link between equations (1) and (2)? To answer that question we must reference a physics law known as The Law of Conservation of Energy . It states that the energy flowing from one gear to another within a gear train remains constant. Energy equates to horsepower, HP, in equations (3) and (4). So if the horsepower flowing through the gears is equal, our working equation becomes: HPDriving = HPDriven (5) Next time we’ll see how equation (5) is key to linking together equations (1) and (2) by way of equations (3) and (4). In so doing we’ll disclose the tradeoff to using gear trains. _______________________________________
|
Gear Reduction Worked Backwards
Sunday, March 9th, 2014|
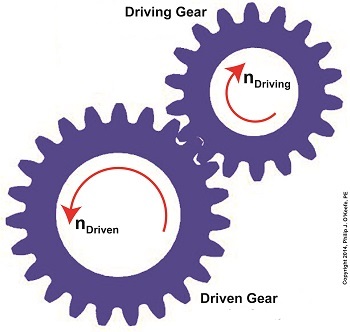
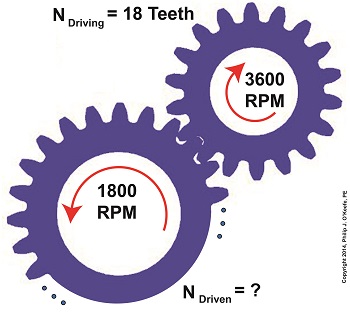
Last time we saw how a gear reduction does as its name implies, reduces the speed of the driven gear with respect to the driving gear within a gear train. Today we’ll see how to work the problem in reverse, so to speak, by determining how many teeth a driven gear must have within a given gear train to operate at a particular desired revolutions per minute (RPM). For our example we’ll use a gear train whose driving gear has 18 teeth. It’s mounted on an alternating current (AC) motor turning at 3600 (RPM). The equipment it’s attached to requires a speed of 1800 RPM to operate correctly. What number of teeth must the driven gear have in order to pull this off? If you’ve identified this to be a word problem, you’re correct. Let’s first review the gear ratio formulas introduced in my previous two articles: R = nDriving ÷ nDriven (1) R = NDriven ÷ NDriving (2) Our word problem provides us with enough information so that we’re able to use Formula (1) to calculate the gear ratio required: R = nDriving ÷ nDriven = 3600 RPM ÷ 1800 RPM = 2 This equation tells us that to reduce the speed of the 3600 RPM motor to the required 1800 RPM, we need a gear train with a gear ratio of 2:1. Stated another way, for every two revolutions of the driving gear, we must have one revolution of the driven gear. Now that we know the required gear ratio, R, we can use Formula (2) to determine how many teeth the driven gear must have to turn at the required 1800 RPM: R = 2 = NDriven ÷ NDriving 2 = NDriven ÷ 18 Teeth NDriven = 2 × 18 Teeth = 36 Teeth The driven gear requires 36 teeth to allow the gear train to operate equipment properly, that is to say, enable the gear train it’s attached to provide a speed reduction of 1800 RPM, down from the 3600 RPM that is being put out from the driving gear. But gear ratio isn’t just about changing speeds of the driven gear relative to the driving gear. Next time we’ll see how it works together with the concept of torque, thus enabling small motors to do big jobs.
_______________________________________ |
When Do You Need To Modify Gear Ratio?
Wednesday, February 19th, 2014|
Last time we saw how the involute profile of spur gear teeth ensures smooth contact between gears when they rotate. Today we’ll see why it’s important to be able to change the rotational speed of the driven gear in relation to that of the driving gear by modifying their gear ratio, the speeds at which gears move relative to one another. Why would we want to modify the rotational speeds of gears relative to one another? One reason is to compensate for the fact that alternating electric current (AC) motors drive most modern machinery, and these motors operate at a fixed speed determined by the 60 cycles per second frequency of electricity provided by the utility power grids of North America. By fixed speed I mean that the motor’s shaft revolves at a single, fixed rate. It can’t run any faster or slower. This is fine for some motorized applications, but not others. Basic machinery such as wood cutting saws, grinders, and blowers function well within the parameters of the AC motor’s fixed speed, because their working parts are intended to rotate at the same rate as the motor’s shaft. As a matter of fact, in this instance there’s often no need for a gear train, because the working parts can be connected directly to the motor’s shaft, and the machinery will be powered and function correctly. There are many instances however in which a fixed speed does not match the speed required for more complex machinery to correctly perform precise, specialized tasks. Take a machine tool meant to cut steel bars, for example. It has a rotating part meant to cut through the steel during machining, and to properly do so its cutting tool bit must turn at 400 revolutions per minute (RPM). If it turns any faster, the cut won’t be smooth and the tool bit will overheat and break due to increased friction. If the AC motor driving the machine tool turns at 1750 RPM, a common speed for such motors, then the tool bit will be turning at a much faster rate than the desired 400 RPM, and this presents a problem. To solve the problem we need only add a gear train between the motor and the part containing the tool bit, meaning, we must connect the gear train’s driving gear to the motor’s shaft and a driven gear to the part’s shaft. But in order for this arrangement to work a conversion must take place, that is, we must design the gear train to operate at a specific gear ratio. By gear ratio, I mean the speeds at which the two gears will rotate relative to one another. Next time we’ll introduce the gear ratio formulas that make it all work.
_______________________________________ |
How A Power Plant Condenser Works, Part 3
Monday, October 14th, 2013|
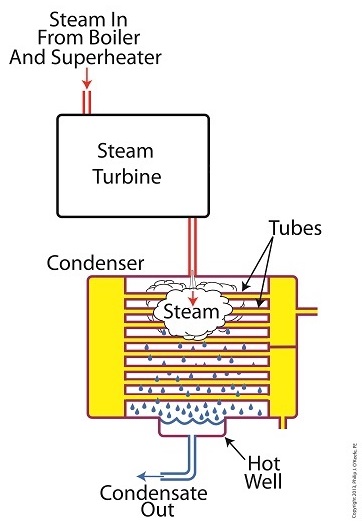
We’ve been discussing various aspects of a power plant’s water-to-steam cycle, from machinery specifics to identifying inefficiencies, and today we’ll do more of the same by introducing the condenser hot well and discussing its importance as a key contributor to the conservation of energy, specifically heat energy. Let’s start by returning our attention to the steam inside the condenser vessel. Last week we traced the path of the condenser’s tubes and learned that the cool water contained within them serve to regulate the steam’s temperature surrounding them so that temperatures don’t rise dangerously high. To fully understand the important result of this dynamic we have to revisit the concept of latent heat energy explored in a previous article. More specifically, how this energy factors into the transformation of water into steam and vice versa. Steam entering the condenser from the steam turbine contains latent heat energy that was added earlier in the water/steam cycle by the boiler. This steam enters the condenser just above the boiling point of water, and it will give up all of its latent heat energy due to its attraction to the cool water inside the condenser tubes. This initiates the process of condensation, and water droplets form on the exterior surfaces of the tubes. The water droplets fall like rain from the tube surfaces into the hot well situated at the bottom of the condenser. This hot well is essentially a large basin that serves as a collection point for the condensed water, otherwise known as condensate. It’s important to collect the condensate in the hot well and not just empty it back into the lake, because condensate is water that has already undergone the process of purification. It’s been made to pass through a water treatment plant prior to being put to use in the boiler, and that purified water took both time and energy to create. The purified condensate also contains a lot of sensible heat energy which was added by the boiler to raise the water temperature to boiling point, as we learned in another previous article. This heat energy was produced by the burning of expensive fuels, such as coal, oil, or natural gas. So it’s clear that the condensate collecting in the hot well has already had a lot of energy put into it, energy we don’t want to lose, and that’s why its an integral part of the water-to-steam setup. It acts as a reservoir, and the drain in its bottom allows the condensate to flow from the condenser, then follow a path to the boiler, where it will be recycled and put to renewed use within the power plant. Next week we’ll follow that path to see how the condensate’s residual heat energy is put to good use. ________________________________________ |
Heat Energy Within the Power Plant – Water and Steam Cycle, Part 1
Monday, August 5th, 2013|
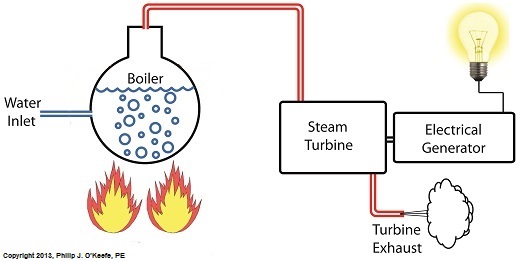
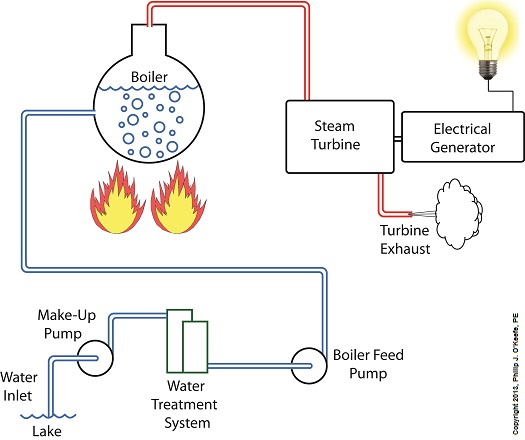
Last time we learned that electric utility power plant boilers are vessels that are reinforced with thick steel and are closed off from the surrounding atmosphere so as to facilitate the building up of highly pressurized steam. This steam is laden with sensible heat energy, meaning it’s a useful energy, and it’s used to run steam turbines, which in turn drive electrical generators. The end result is power to consumers. Let’s now revisit our basic electric utility boiler diagram to see how water and steam flow. Water is fed into the boiler, heat is applied externally, and steam exits through a pipe leading to the steam turbine. You’ll notice that after the steam passes through the turbine, some of it is expelled into the surrounding atmosphere. Since water is being continuously boiled off to produce steam, the boiler must be continuously replenished with a fresh supply. This is typically supplied by a nearby body of water, hence one reason that power plants are often situated on a lake or river. Since water contains both minerals and organic matter, including algae, a treatment system to remove these contaminants must be added to the water’s inlet area before it can be used. This will keep operating parts such as the boiler and turbine free of damaging deposits. The treatment system operates much like the water softener in your home, but on a larger scale. Lake water is drawn into the system by a make-up pump, so named because it makes up, or replenishes spent water with a fresh supply. The result is clean, mineral-free water that’s delivered to the boiler by a boiler feed pump, so named because its specific function is to feed water to the boiler. Feeding water to the boiler on a continuous basis is no easy task because of the steam straining to break free, and boiler feed pumps are massively powerful devices built to accomplish this. They effectively force water into the boiler even as high internal pressures try to force the water out. This pressure is often greater than 1,500 pounds per square inch (PSI) in modern power plants. So at this point we’ve discussed the fact that the boiler requires a continuous supply of fresh water, which is converted into high pressure steam, which is then sent on to spin a steam turbine. The turbine powers an electrical generator, resulting in usable energy. If you’ve been reading along closely, you will have identified that as things stand now it’s a rather inefficient and wasteful system, a point which we’ll address in next week’s blog. ___________________________________________
|
